
as a Service easily, faster, smart
From day-to-day reporting to full analytics, a few hours a month, to a full-time resource, consider us your outsourced IT.
Business Intelligence
We believe data analytics isn't just for large businesses.
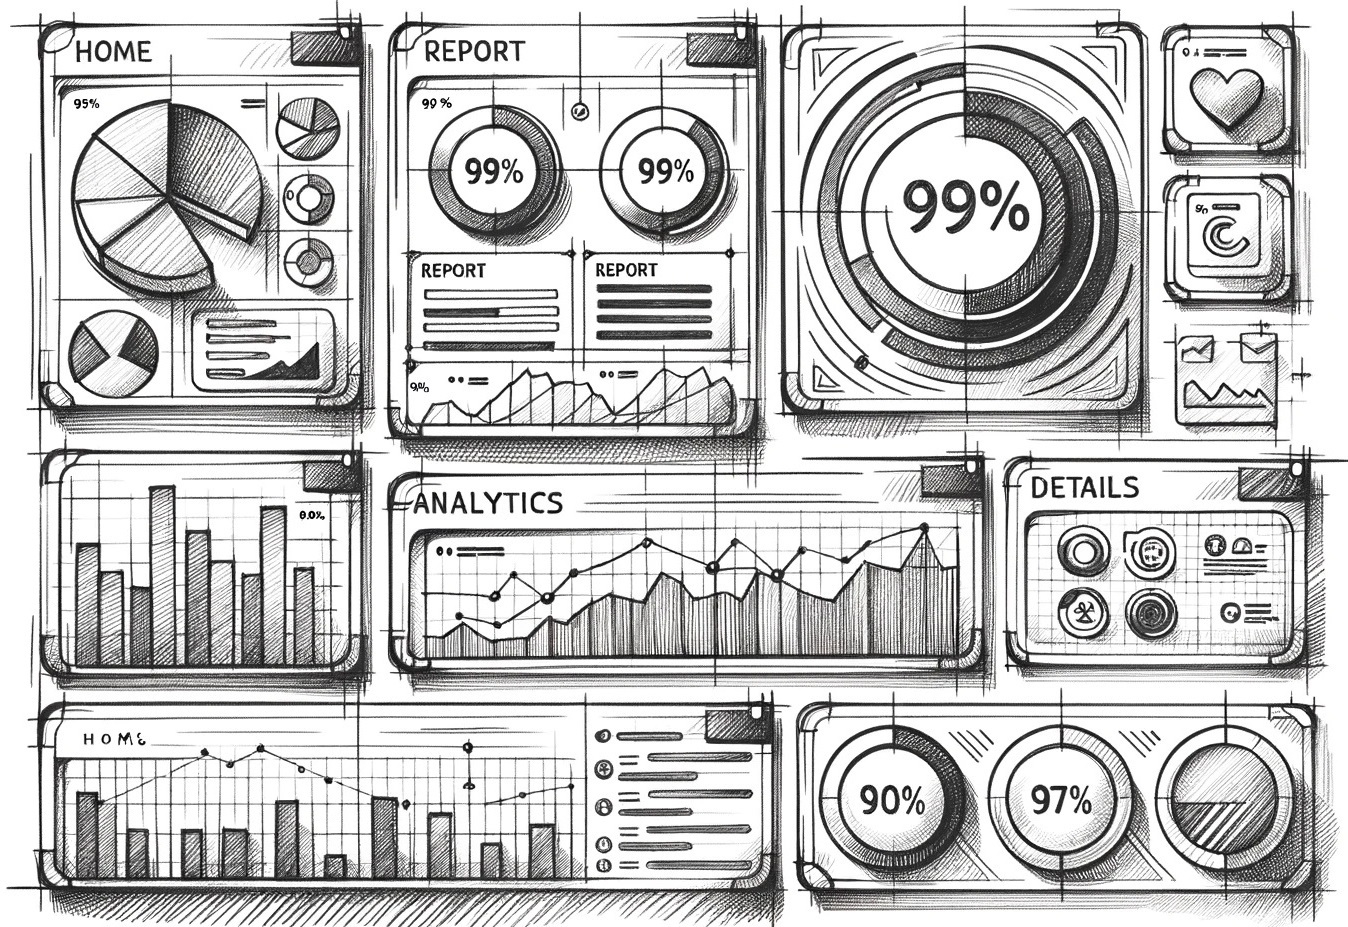
We're committed to bringing these services to SMEs as well. Business Intelligence Dashboard provides a real-time snapshot of an organization's performance, allowing stakeholders to quickly interpret complex data and make informed decisions.

Our Approach
We prioritize non-technical users.
We design intuitive, mobile-optimized Power BI reports that deliver actionable insights quickly, empowering proactive, informed business decisions.
Define the end goal
Empower users with actionable data
Keep it Simple
Our Services
You no longer require an IT background to craft powerful analytics—leave that to us.
Our Power BI services include: BI assessment, Reporting and analytics & Managed Services
BI assessment
BI strategy
New opportunities and goals are discovered during the assessment process improving chances of an increase in ROI.
Reporting and analytics
Dashboard Design & Building
Design, create, and deploy interactive Power BI dashboards tailored to your needs.
Data Governance
Data Mangement
Establish robust policies ensuring impeccable data quality, optimum accessibility, and utmost protection against potential threats.
Managed Services
Maintenance & Updates
Dedicated support to regularly refine, update, and troubleshoot your dashboards, adapting to your evolving business needs.
Why choose us?
Budget-aligned solutions, rapid delivery, uncompromised quality. Your success is our priority.
Innovative Approach to Data Solutions
Cost-effective, Maximum ROI
Agile and Swift Project Turnaround
Seamless Integration Across Platforms
Managed Services
Professional BI Support Plans
Essential
- Up to 2 dashboard maintenance
- Monthly data refresh monitoring
- Basic troubleshooting support
- Email support (48hr response)
- 1 minor modification per week
- Custom report development
- Priority support
- Strategy consultation
Professional
- Up to 5 dashboard maintenance
- Weekly data monitoring
- Proactive issue resolution
- Priority support (24hr response)
- 3 modifications per week
- 1 new report per quarter
- Performance optimization
- Monthly consultation (1hr)
Enterprise
- Unlimited dashboard maintenance
- Real-time monitoring & alerts
- 24/7 technical support
- Dedicated account manager
- Unlimited modifications
- 5 custom reports per quarter
- Advanced analytics & forecasting
- Weekly strategy sessions
Custom Enterprise Solutions
Need something more specific? We offer tailored BI solutions for complex requirements, multi-location businesses, and specialized industries. Our enterprise packages include dedicated resources, custom SLAs, and strategic consulting.
Schedule ConsultationSecure Sharing
We believe secure report sharing shouldn't cost a fortune.
We offer a solution that adds authentication layers to your published to web reports, controlling who sees what data while maintaining cost-effective sharing.


Selected Work
Featured Projects
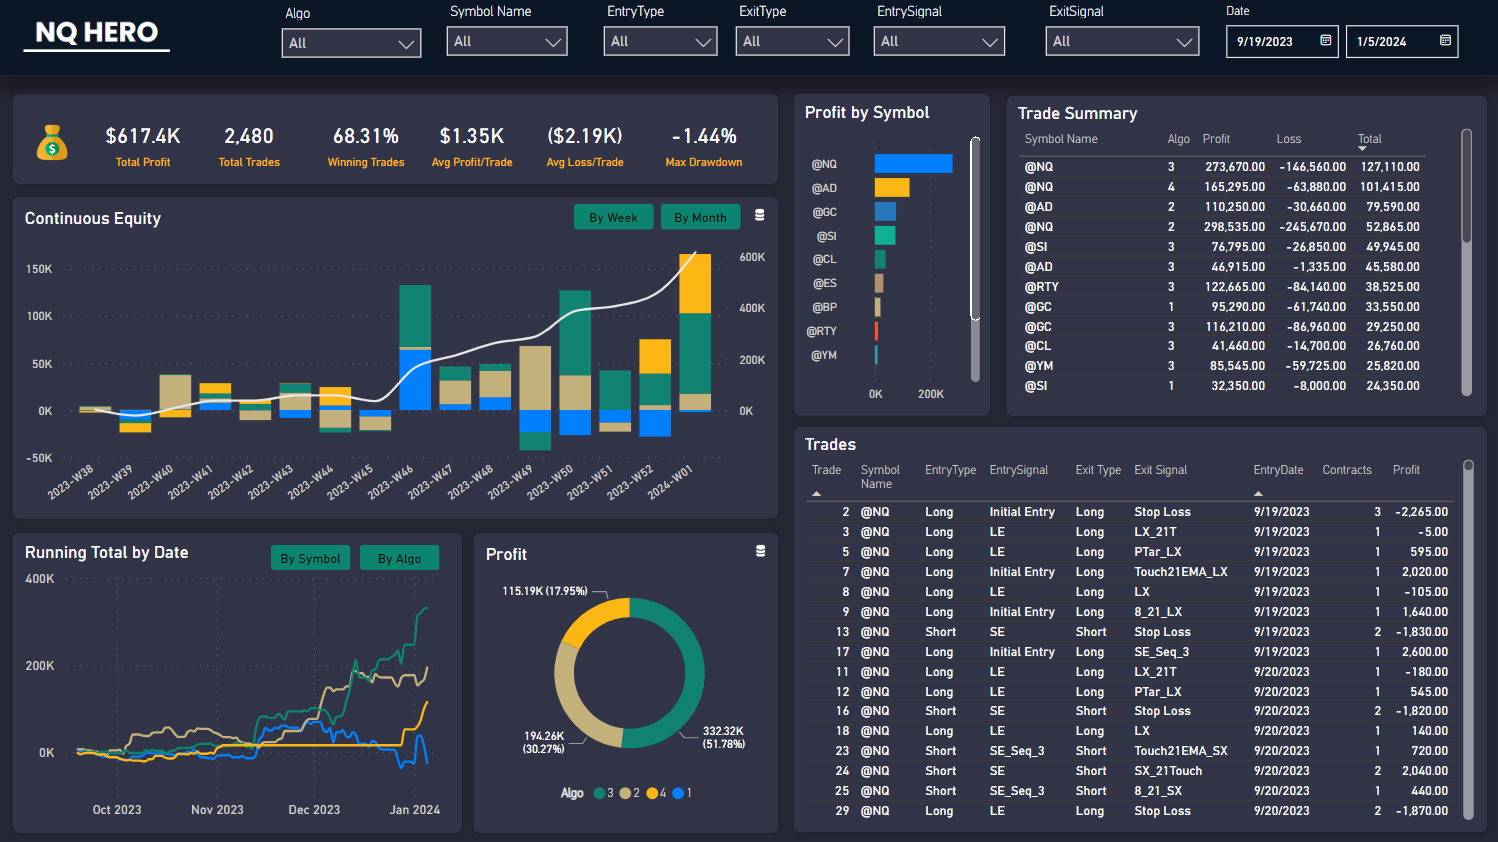
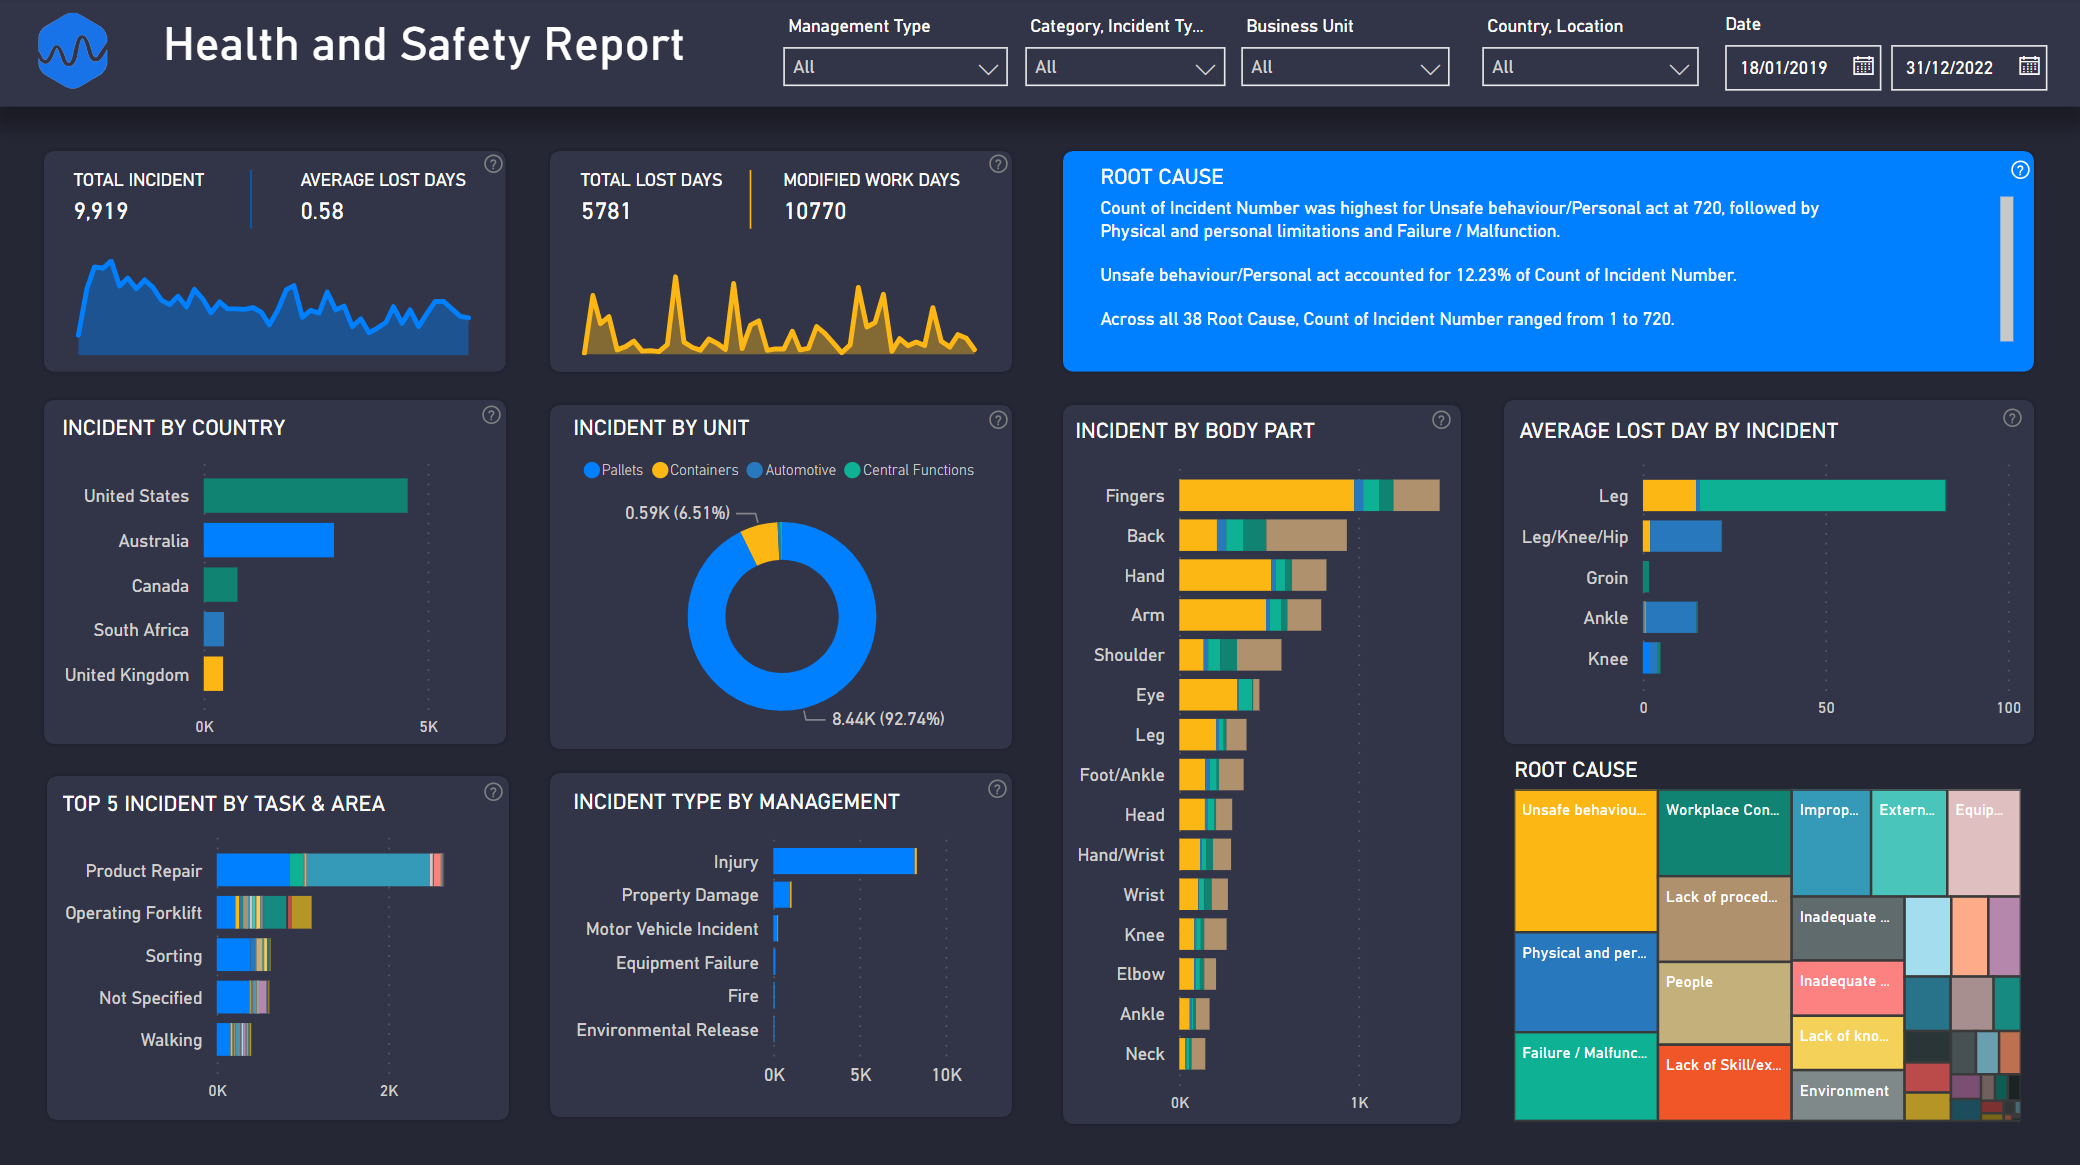
Sales Analytics
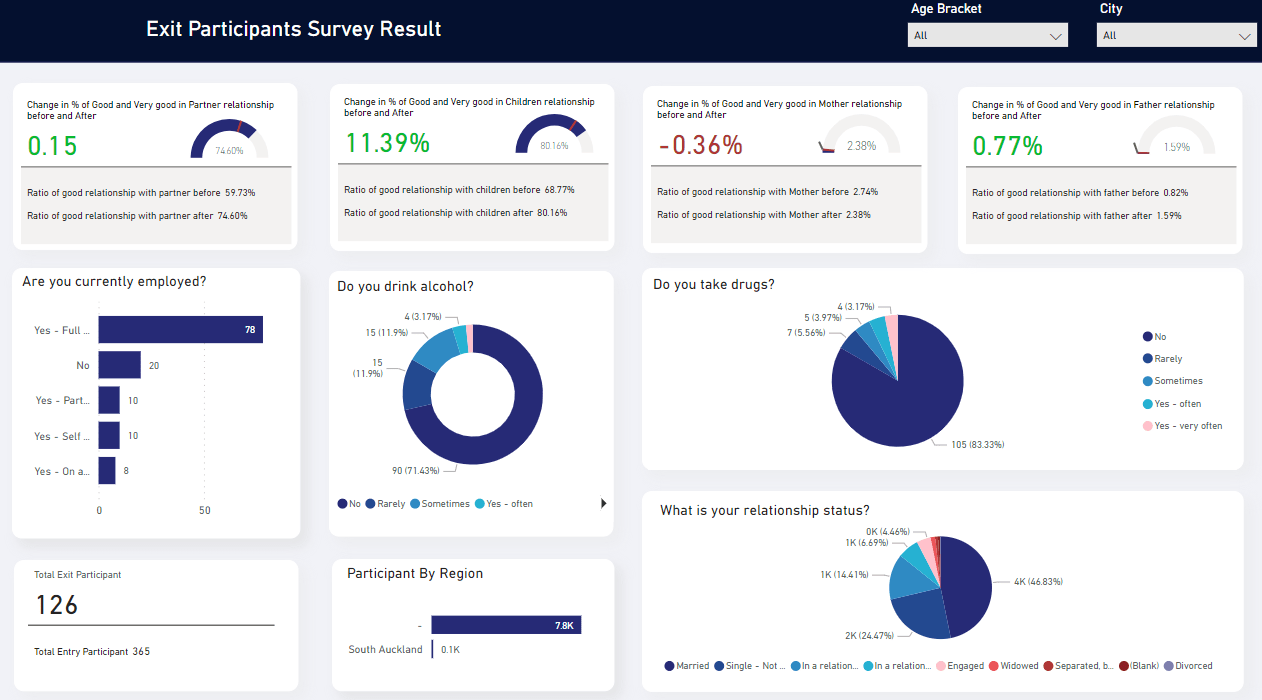
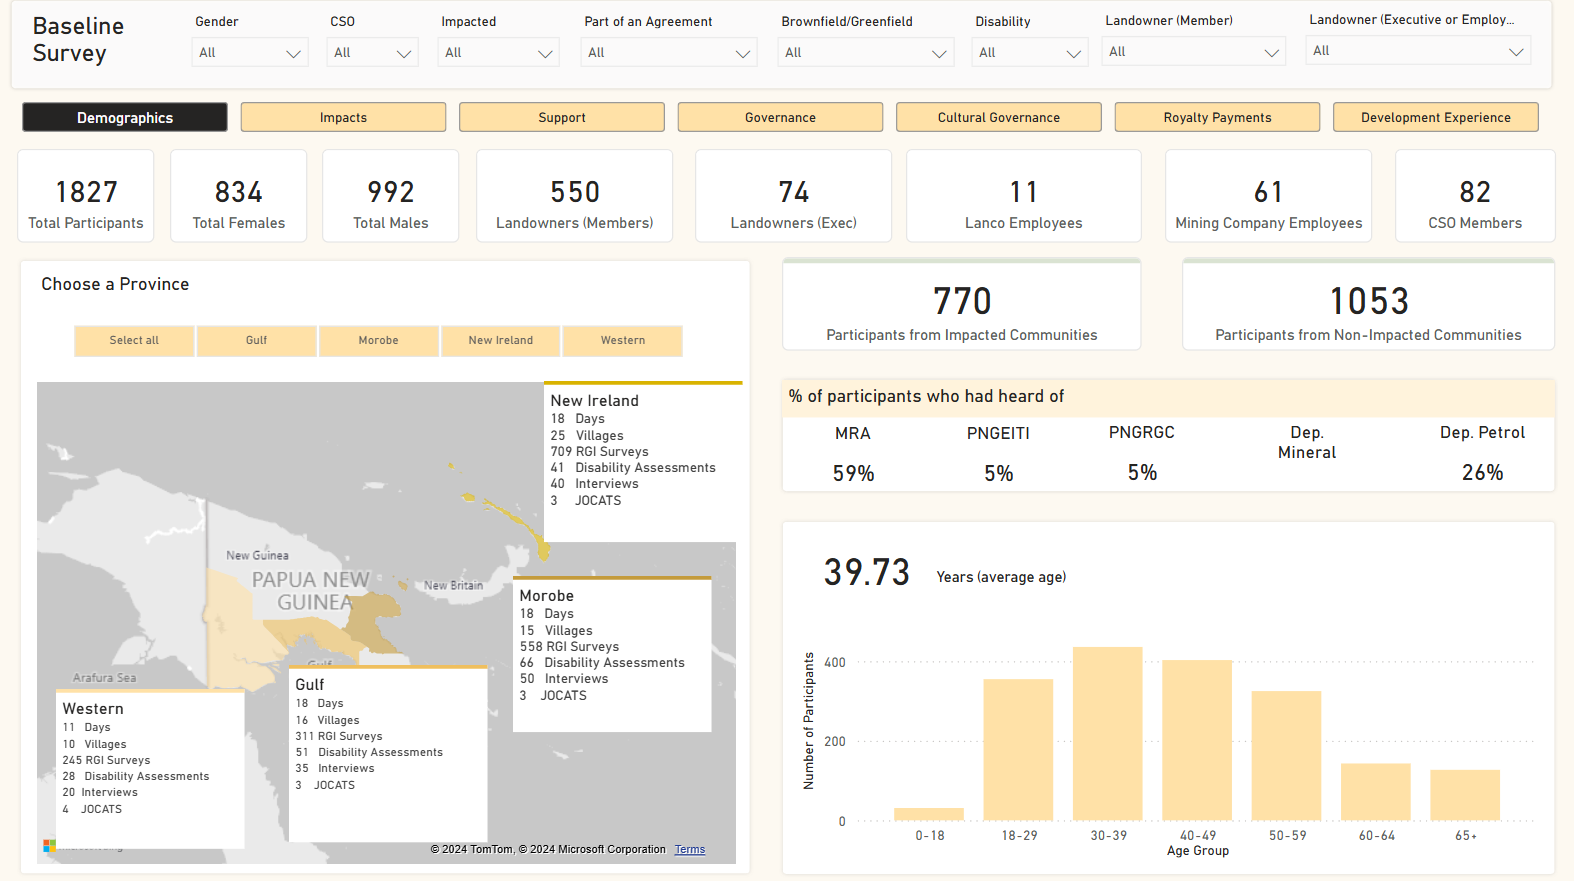
Survey Overview
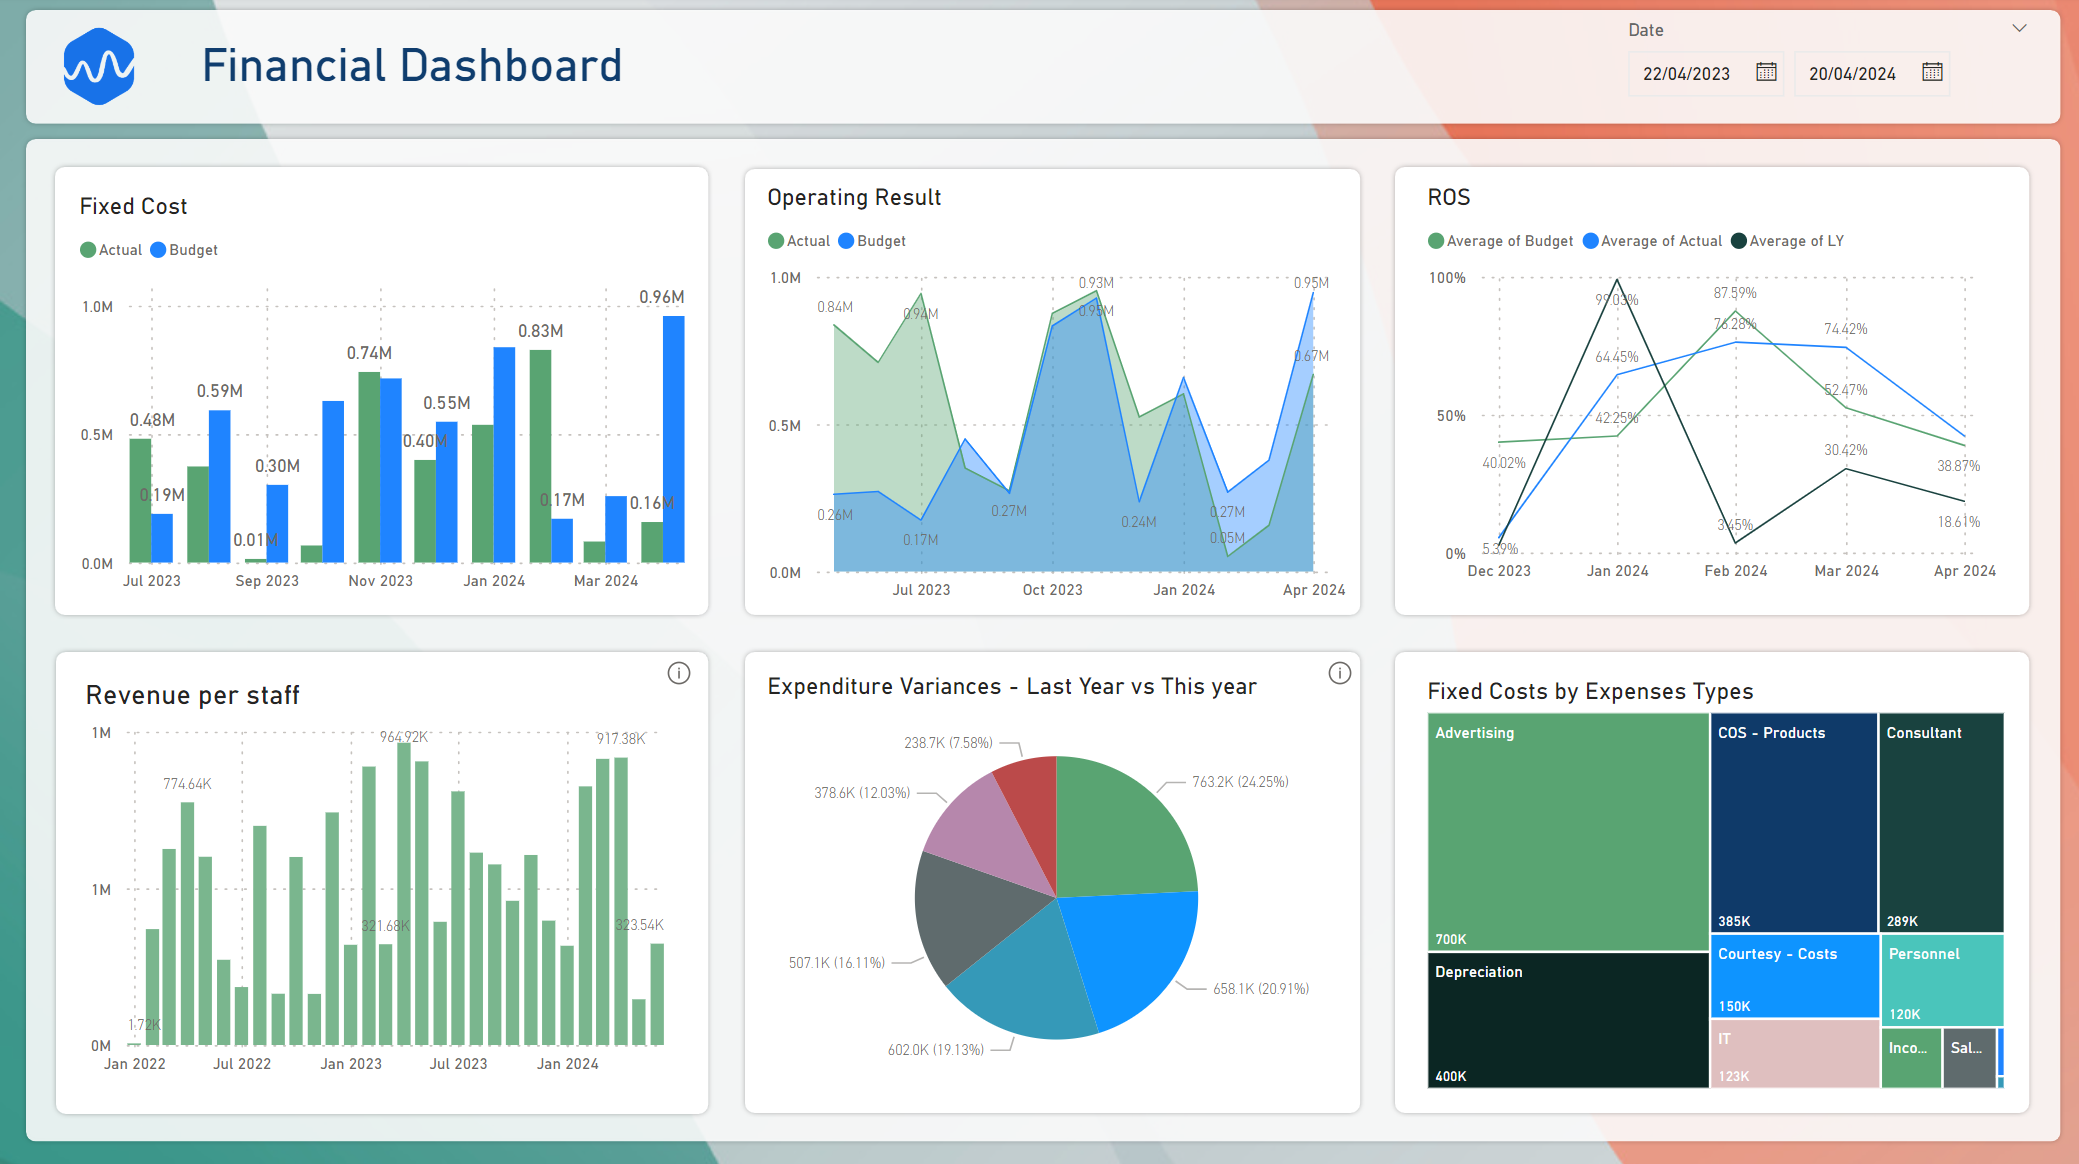
Financial Metrics
Inventory Management
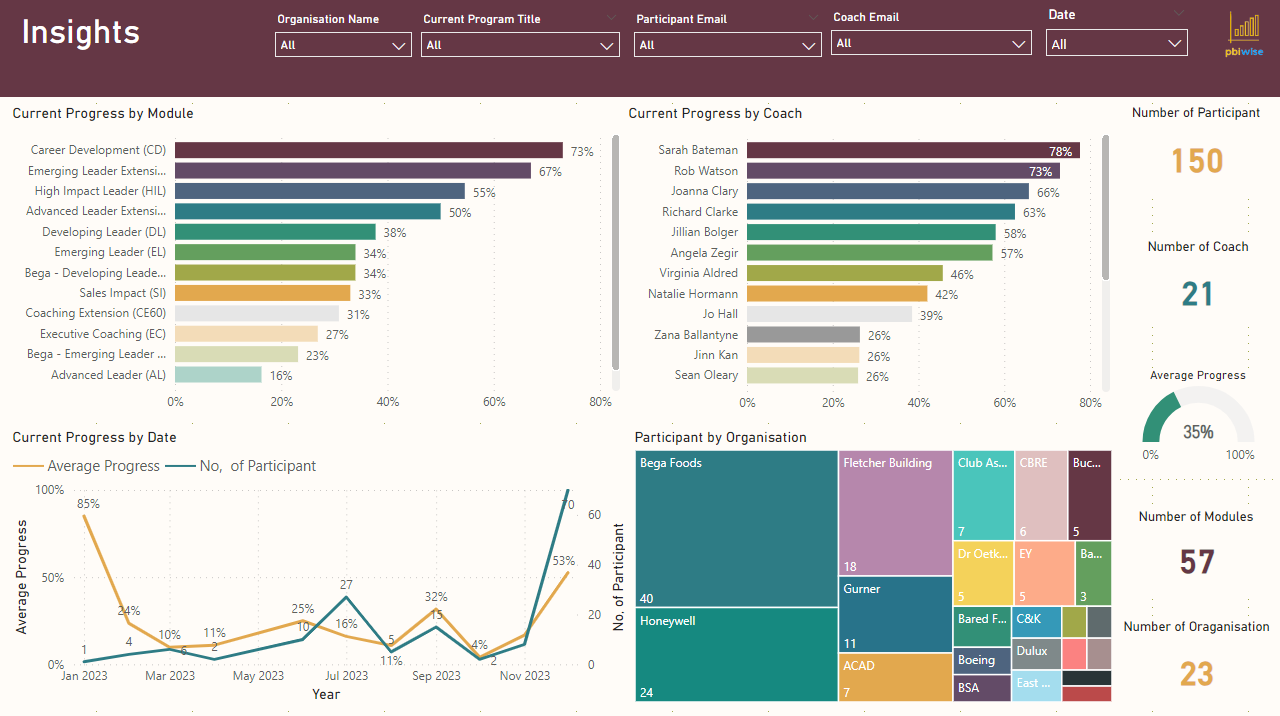
Performance KPIs
Business Analytics
Selected Work
Case Study
Project Details
Description
An architecture firm required advanced analytical capabilities to evaluate area distribution and room specifics within their AutoCAD Revit designs. The traditional approach was cumbersome and disconnected from real-time data. PBIWise addressed this challenge by creating a Power BI solution that seamlessly ingests Revit file data. Our dashboard provides layered insights into area usage by floor and analysis by individual rooms, enriched with interactive 3D models within Power BI. This integration elevates design decision-making, ensuring adherence to project specifications and optimizing spatial efficiency for the client’s projects.
Unlock Free Insights
To better understand your needs and demonstrate our value, we offer a complimentary 1-hour consultancy session.
FAQs
- What about data privacy?
-
We take data privacy and security very seriously. Before we start any project, we ensure that both parties are protected by signing a Confidentiality Agreement.
This legally binding agreement outlines the terms and conditions under which your data will be handled, ensuring that your sensitive information remains private and secure throughout the analysis process. - What if I don't want to give away my data, can you still help?
-
Absolutely! We understand that data security is a top concern. If you're not comfortable sharing your actual data, we can still provide valuable insights and solutions. We can set up a report using test data that closely simulates your real-world scenarios.
Once the report is up and running and you're satisfied with how it works, you can simply replace the simulated data with your actual data whenever you're ready. This way, you can experience the power of our services without compromising the security of your sensitive information. - How can I ensure my BI dashboard provides a good investment?
-
A worthwhile BI dashboard is built by establishing clear goals, selecting meaningful metrics, designing for user-friendliness, maintaining data accuracy, and continually refining the dashboard based on user feedback.
For example, a company invested a few thousand dollars in a BI dashboard to enhance their business insights for better decision-making. After implementation, the dashboard helped streamline the staff roster timetable, saving several hundred dollars per week. It also pinpointed inefficient marketing channels, leading to a reduction in costs by a few thousand dollars. Additionally, smarter inventory decisions based on the insights saved thousands more in holding costs.
The dashboard also allowed the company to promptly spot any budgetary issues, enabling immediate corrective action. Additionally, with access to enhanced insights, the company could identify new potential markets, allowing for proactive strategic planning. - What are the benefits of using BI dashboards?
- BI dashboards bring numerous advantages to businesses. They enhance data visualization, provide insights, foster data-driven decisions, streamline operations, and reveal significant trends, all of which contribute to improved efficiency and strategic planning.
- What kind of data can be displayed on a BI dashboard?
- BI dashboards have the flexibility to showcase diverse data types, ranging from financial and sales data to operational metrics, customer insights, and employee performance indicators.
- What is the process of creating a BI dashboard?
- Crafting a BI dashboard involves gathering requirements, collecting and transforming data, creating visualizations, developing the dashboard, testing its functionality, deploying it to users, and offering necessary training.
- Can the BI dashboard integrate data from multiple sources?
- Our BI dashboard is designed to seamlessly integrate data from multiple sources. Whether it's data from your SQL, web, csv, spreadsheets, or other databases, our dashboard consolidates and presents the information cohesively, giving you a holistic perspective of your operations.
- What tools are used to create BI dashboards?
-
We leverage a diverse array of tools for dashboard creation, including Power BI, Tableau, Looker Studio, and more.
If you are still unsure which tool to use, please check out our Power BI vs Tableau vs Looker Studio comparison to help make an informed decision.